


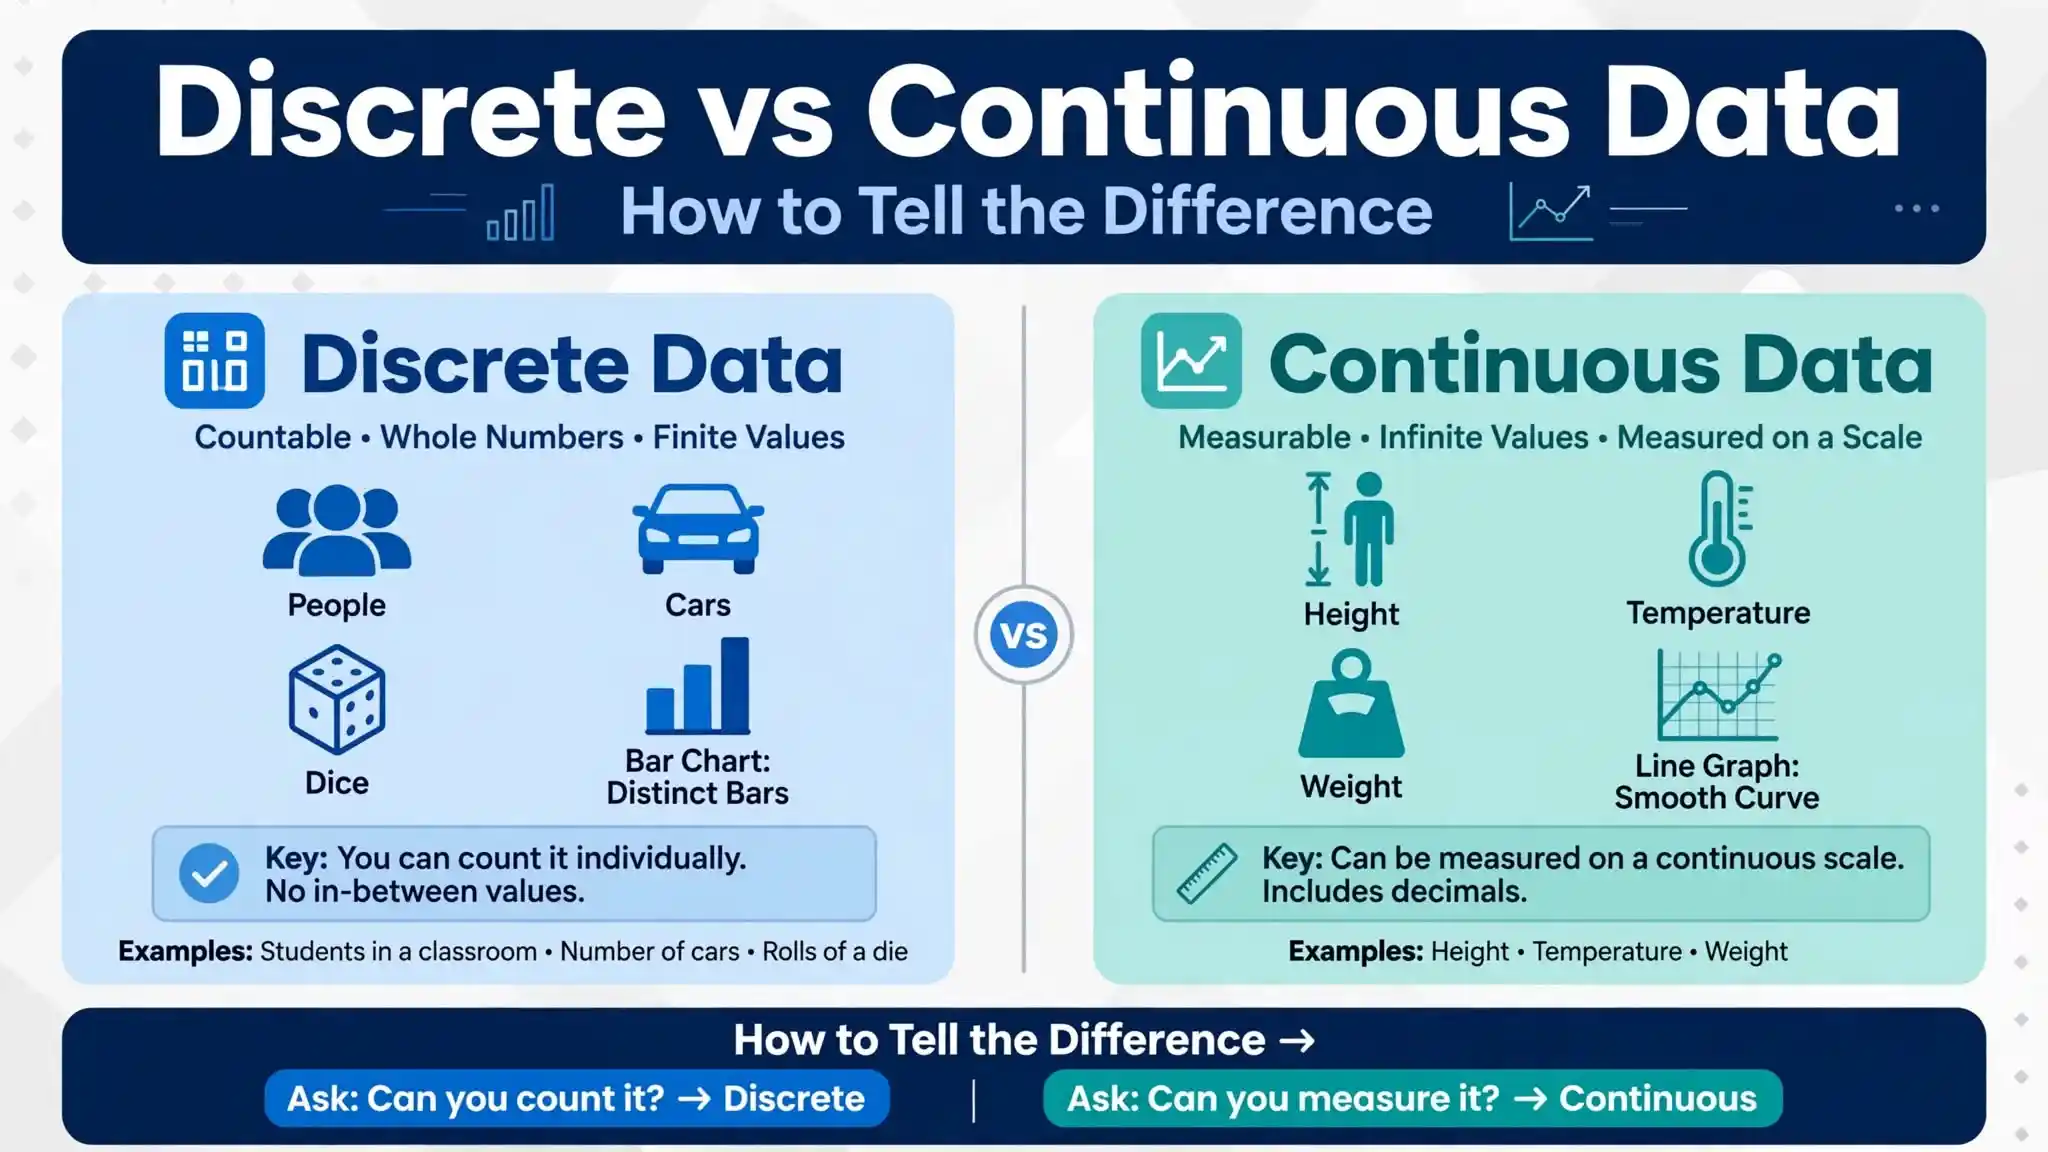
Discrete vs continuous comes down to one question: is the number counted or measured? Discrete data is counted and takes separate values with gaps between them, like 3 students in a class. Continuous data is measured and can take any value within a range, like a height of 1.734 metres. Open any spreadsheet and you will find both kinds of numbers side by side.
Getting this right matters far beyond the classroom. The type of data decides which chart you can draw, which average makes sense, which probability model fits, and which statistical test you can trust. A wrong call at the start can quietly spoil everything that follows.
In this guide you will learn what each word means, how people use them in everyday speech (including the slang-like mix-up with “discreet”), and how to tell them apart in seconds. The discrete vs continuous comparison is much easier than it looks once you have a simple test, and you will get one below, along with examples, common mistakes, practice questions, and FAQs.
What Does Discrete Mean?
Discrete means separate and distinct. In everyday English it describes things that stand apart from each other. In maths and statistics, a discrete variable can take only certain, separate values, and those values usually come from counting.
A family can have 2 children or 3 children, but never 2.5 children. Other examples include:
- the number of students in a class
- goals scored in a match
- emails received in a day
- defective items on a production line
- slices in a pizza
- cars in a parking lot
Discrete data is the information you collect from variables like these. Because the possible values can be listed one by one, it is usually shown with tally charts, frequency tables, and bar charts.
Discrete does not always mean whole numbers. A shoe size can be 8 or 8.5, but not 8.25, so shoe sizes are discrete too. The key idea is the gap between neighbouring values, not the absence of a decimal point.
What Does Continuous Mean?
Continuous means unbroken and uninterrupted. In maths and statistics, a continuous variable can take any value within a range, including decimals and fractions. Between 1.70 m and 1.71 m there are infinitely many possible heights, such as 1.705 or 1.7049. Weight works the same way: 150 pounds, 150.5 pounds, 150.55 pounds, and so on.
Typical examples are:
- height and weight
- time taken to finish a task
- temperature
- distance travelled
- the speed of a car
Measuring quantities like these gives you continuous values. Instruments limit precision, but the underlying quantity can still take any value, which is why we call it continuous.
What Do These Words Mean in Everyday Language? (Slang and Common Confusion)
Neither “discrete” nor “continuous” has an established slang meaning. If you have seen them used in a slang-like way, it is almost always one of the mix-ups below.
Discrete vs discreet. These two words sound exactly the same but mean different things.
- Discrete means separate, distinct, countable.
- Discreet means careful, tactful, or private, as in “a discreet exit” or “a discreet inquiry.”
Many people type one when they mean the other. A simple memory trick: in discreet, the two e’s sit side by side, like two people keeping a secret together. In discrete, the e’s are separated by the t, just like discrete things are separated.
Continuous vs continual. In casual speech, people treat these as the same word, but they are not. Continuous means without any break, like continuous rain all day. Continual means repeated with breaks in between, like continual interruptions during a meeting. In informal talk, “continuous” is often replaced by phrases like “non-stop,” “round the clock,” or “on repeat.”
Discrete vs Continuous: Key Differences
| Feature | Discrete | Continuous |
|---|---|---|
| How it is obtained | Counting | Measuring |
| Possible values | Separate, listable values | Any value in a range |
| Gaps between values | Yes | No |
| Typical examples | Number of books, goals, customers | Height, time, temperature |
| Typical charts | Bar chart, dot plot | Histogram, line graph, box plot |
| Random variable | Discrete random variable | Continuous random variable |
| Probability tool | Probability mass function | Probability density function |
Counting gives discrete, measuring gives continuous. If you remember only one line from this guide, make it that one.
A Simple Four-Question Test
When you are unsure about discrete vs continuous, run the quantity through these four questions:
- Am I counting or measuring? Counting points to discrete. Measuring points to continuous.
- Does a half or a fraction make sense? 2.5 customers does not, but 2.5 kilograms does.
- Can I list the possible values? If you can, even as an endless list like 0, 1, 2, 3, the quantity is discrete.
- Is there always another value between any two values? If yes, it is continuous.
If most answers point the same way, you have your answer.
Examples of Discrete and Continuous Data
| Quantity | Type | Why |
|---|---|---|
| Number of siblings | Discrete | Counted in whole units |
| Weight of a newborn | Continuous | Measured on a scale |
| Number of website visits | Discrete | Each visit is counted |
| Time to run 100 metres | Continuous | Can be any fraction of a second |
| Pages in a book | Discrete | Whole pages only |
| Rainfall in a month | Continuous | Measured in millimetres |
| Temperature at noon | Continuous | Any value on the scale |
The same pattern shows up in sport: runs scored and wickets taken in cricket are discrete, while a bowler’s speed in km/h is continuous.
Interval and Ratio: The Two Kinds of Continuous Measurement
Continuous values are often described at two levels of measurement, and the difference is whether zero means “none at all.”
- Interval values have equal steps, but zero is just a point on the scale. Temperature in degrees Celsius is the classic case. 0°C does not mean no temperature, and 20°C is not “twice as hot” as 10°C.
- Ratio values have a true zero, so zero means nothing is there. Weight, height, distance, and time are ratio values. 20 kg really is twice as heavy as 10 kg.
This matters because ratio values allow every kind of comparison, including “twice as much,” while interval values do not. A common shortcut says interval values can be negative and ratio values cannot. That is only partly true. The real test is whether zero means “none.”
Discrete vs Continuous in Statistics
In statistics, this choice shapes the whole analysis. Continuous variables suit descriptive measures such as the mean, median, range, and standard deviation. Discrete variables take fixed values, so counts, frequencies, and proportions often tell the story better than an overall average, although the mean still works. The average number of children per family can be 2.4 even though no real family has 2.4 children.
Two practical notes are worth remembering. When a discrete variable has a huge number of possible values, such as a country’s population, analysts often treat it as continuous, because the gaps are tiny compared with the scale. The reverse also happens: continuous measurements recorded in rounded units, like age in whole years, can look discrete. Think about what is being measured, not only how it was written down.
The type also guides your choice of test. Sometimes you want to link two kinds of values, such as gender (a category) and height (a measurement). Comparing height between the two groups points to a t-test. Linking two sets of categories points to chi-squared. Predicting a yes-or-no outcome points to logistic regression, and modelling counts, such as hospital visits per year, often points to Poisson regression. Using the wrong method for the wrong type is a common cause of misleading results.
Discrete Data Is Not the Same as Categorical Data
Categorical variables describe groups, such as blood type, city, or colour. Their values are labels, not counts or measurements. A common mistake is to code a category with numbers, such as 1 for male and 2 for female, and then treat the result as a discrete variable. The numbers are only names. Taking their average would be meaningless, and the right summary is the proportion in each group.
How to Graph Discrete and Continuous Data
The right chart helps your reader see the data the way it really behaves.
- Discrete data: bar charts and dot plots work well because each value stands alone, and the bars are separated by gaps. Pie charts and mosaic plots suit shares of categories, though pie charts work best with only a few slices.
- Continuous data: histograms, box plots, and line graphs show how values are spread across a range. A histogram has touching bars because the intervals run into each other with no break. Grouped frequency tables work too, and a scatter plot shows the link between two continuous variables.
Joining the dots for discrete counts, such as goals per match, can suggest in-between values that do not exist, unless you are deliberately showing a trend over time.
Probability: Discrete and Continuous Random Variables
Probability is where the discrete vs continuous split becomes sharpest.
A discrete random variable takes countable values, such as the number of heads in 10 coin tosses. Rolling a die gives a discrete random variable with six possible outcomes. Its probability distribution is described by a probability mass function (PMF), which gives the exact probability of each value. Familiar examples are the binomial, Poisson, and geometric distributions.
A continuous random variable can take any value in an interval, such as the waiting time for a bus. Its probability distribution is described by a probability density function (PDF). Probabilities are found as the area under the curve between two points, and the probability of any single exact value is zero. Familiar examples are the normal, uniform, and exponential distributions.
So a discrete random variable uses sums of probabilities, while a continuous random variable needs a curve and integrals, not a list. Either way, the total probability must equal 1.
Discrete and Continuous in Math and Technology
In algebra and calculus, a discrete function is defined only at separate points, such as the cost of buying 1, 2, or 3 tickets. Its graph is a set of dots. A continuous function is defined across an interval and can be drawn without lifting your pen, such as distance travelled over time.
Technology follows the same pattern. A digital signal is discrete, taking values like 0 and 1. An analog signal is continuous and varies smoothly. Computers approximate continuous quantities with discrete ones: digital audio stores a sound wave as thousands of samples per second, and a photograph is stored as a grid of discrete pixels.
Tricky Cases
Some quantities do not fit neatly into one box.
- Age: a continuous variable in principle, because time passes smoothly, but usually recorded in whole years, which makes it look discrete.
- Money: a price is a discrete variable because the smallest unit is a cent or a paisa, but large financial totals are often treated as continuous.
- Test scores: marks are whole numbers, yet analysts often treat them as continuous when there are many possible scores.
A good rule of thumb: ask what the quantity could be in principle, then ask how it was recorded. Both answers matter.
Who Uses Discrete and Continuous Data?
Almost every data-driven job relies on both types. In health care, the number of patients diagnosed with a disease is a count that guides public health planning, while a patient’s body temperature or blood pressure is a measurement that guides individual treatment. In business, units sold inform inventory decisions, while time spent on a website shapes marketing strategy. Roles that work with these values every day include:
- data analyst
- market research analyst
- data architect
- machine learning engineer
- project manager
- marketer
Knowing which type you hold lets each of them choose the right method and avoid misleading results.
Common Mistakes
Most errors in discrete vs continuous come from judging by appearance instead of by meaning.
- Thinking decimals always mean continuous. Shoe sizes and prices have decimals but are discrete.
- Thinking whole numbers always mean discrete. Age in years uses whole numbers, but it is a continuous variable that has been rounded.
- Using the wrong chart. A bar chart for raw continuous measurements hides their shape, while a histogram shows it.
- Confusing numeric codes with discrete data. Labels coded as 1 and 2 are categories, not counts.
- Mixing up discrete and discreet. One is about separation, the other is about privacy and tact.
Quick Practice
Classify each item as discrete or continuous:
- The number of text messages you sent today
- Your weight in kilograms
- The number of pages in a novel
- The time it takes to boil water
- The number shown after rolling a die
Answers: 1 discrete, 2 continuous, 3 discrete, 4 continuous, 5 discrete. If any answer surprised you, go back to the four-question test.
FAQs
How do I quickly tell discrete vs continuous apart? Ask whether you are counting or measuring. Counting gives discrete values, and measuring gives continuous values.
What does discrete mean in simple words? It means separate and countable, with clear gaps between the possible values.
What does continuous mean in simple words? It means unbroken, where a value can land anywhere in a range with no gaps.
What is a discrete random variable? It is a numerical outcome of a random process that takes countable values, such as heads in 10 coin tosses. Its probability distribution lists each value with its probability.
What is a continuous random variable? It can take any value in an interval, such as a waiting time. Its probability distribution is shown as a smooth curve.
Is age discrete or continuous? In principle, age is continuous because time flows without gaps. It becomes discrete only when we record it in whole years.
Can discrete data have decimals? Yes. Shoe sizes like 8.5 are discrete because the allowed values are still separate.
Can continuous data be whole numbers? Yes. If a measurement is rounded, such as weight to the nearest kilogram, it can look like whole numbers.
What is the difference between discrete and discreet? Discrete means separate or distinct. Discreet means careful, tactful, or private.
Conclusion
The discrete vs continuous question comes down to one habit: ask whether you are counting or measuring. Discrete values live in separate steps, with gaps you can see and list. Continuous values flow without breaks, and between any two values there is always another. Once you can tell them apart, choosing the right chart, summary, and probability distribution becomes much easier. Use the four-question test whenever you are unsure, and remember that how a value is recorded is not always what it truly is.
